
Tutorial interactivo
Excel Sparklines
Learn How to Create and Customize Sparklines in Excel to Visualize Data Trends Within Cells
-
Aprender haciendo
-
LMS listo
-
Obtenga certificados

Pruebe este curso con una prueba gratuita
Sparklines provide a way to chart information in the individual cells of a worksheet. They are a great way to show a snapshot of the worksheet data.
Insert Sparklines
When you save a chart as a template, that chart’s properties are saved for easy future use.
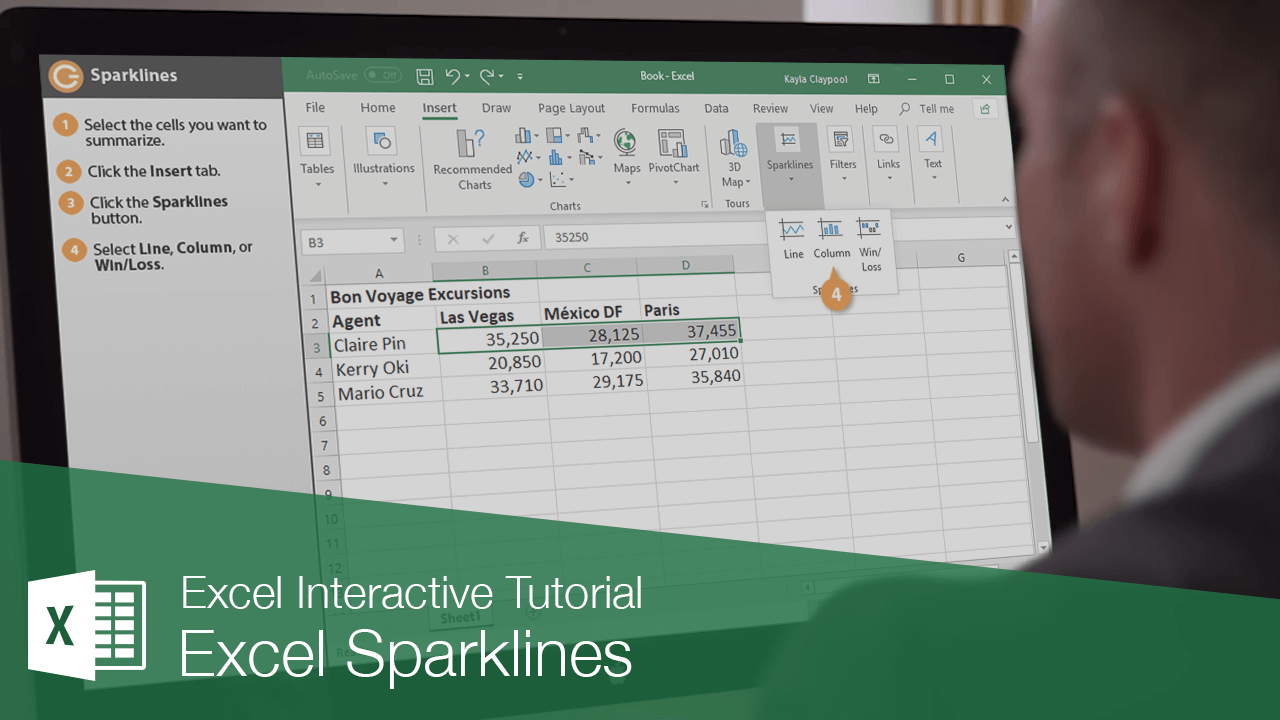
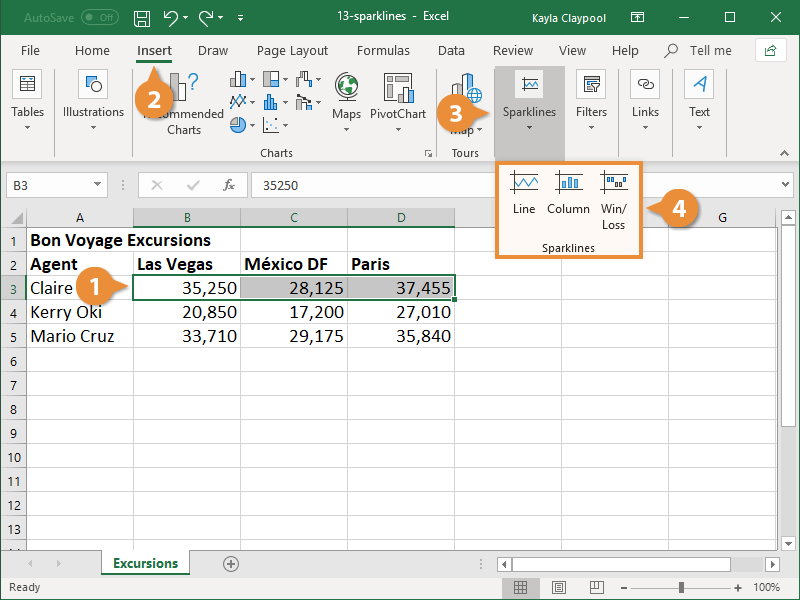
- Select the cells you want to summarize.
- Click the Insert tab.
- Click the Sparklines button.
- Select a sparkline type.
- Line: Shows trends in the data over time.
- Column: Shows differences in quantity.
- Win/Loss: Shows gains or losses.
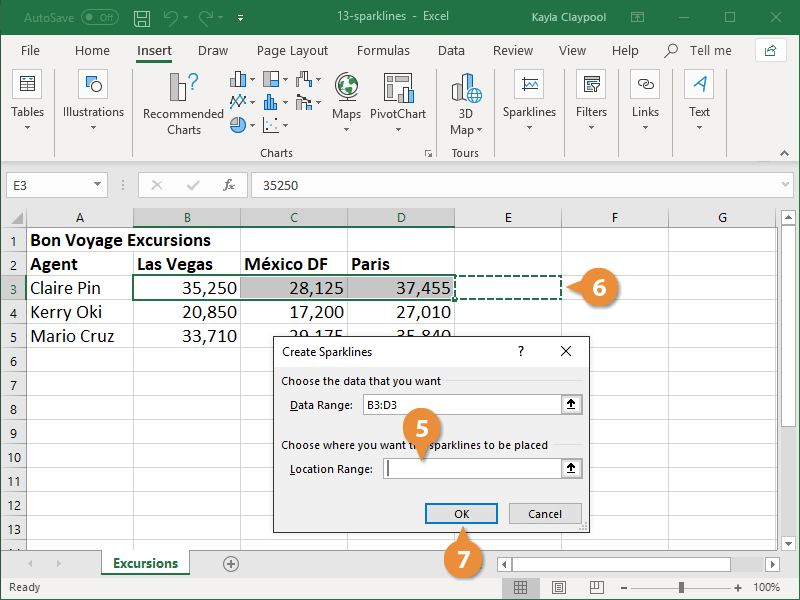
The Create Sparklines dialogue box appears. When a cell range is already selected, the Data Range field is automatically populated. If you didn’t select a range previously, enter it in the Data Range field.
- Click in the Location Range field.
- Select the cell where you want the sparkline to appear.
- Click OK.
You can change the sparkline’s style by selecting it, clicking the Design tab, and selecting a style from the Style Gallery.
A Sparkline is added to the worksheet.