
Interactive Tutorial
Quick Analysis Tool in Excel
Learn How to Use the Quick Analysis Tool in Excel to Instantly Visualize, Summarize, and Format Data
-
Learn by Doing
-
LMS Ready
-
Earn Certificates

Try this Course with a Free Trial
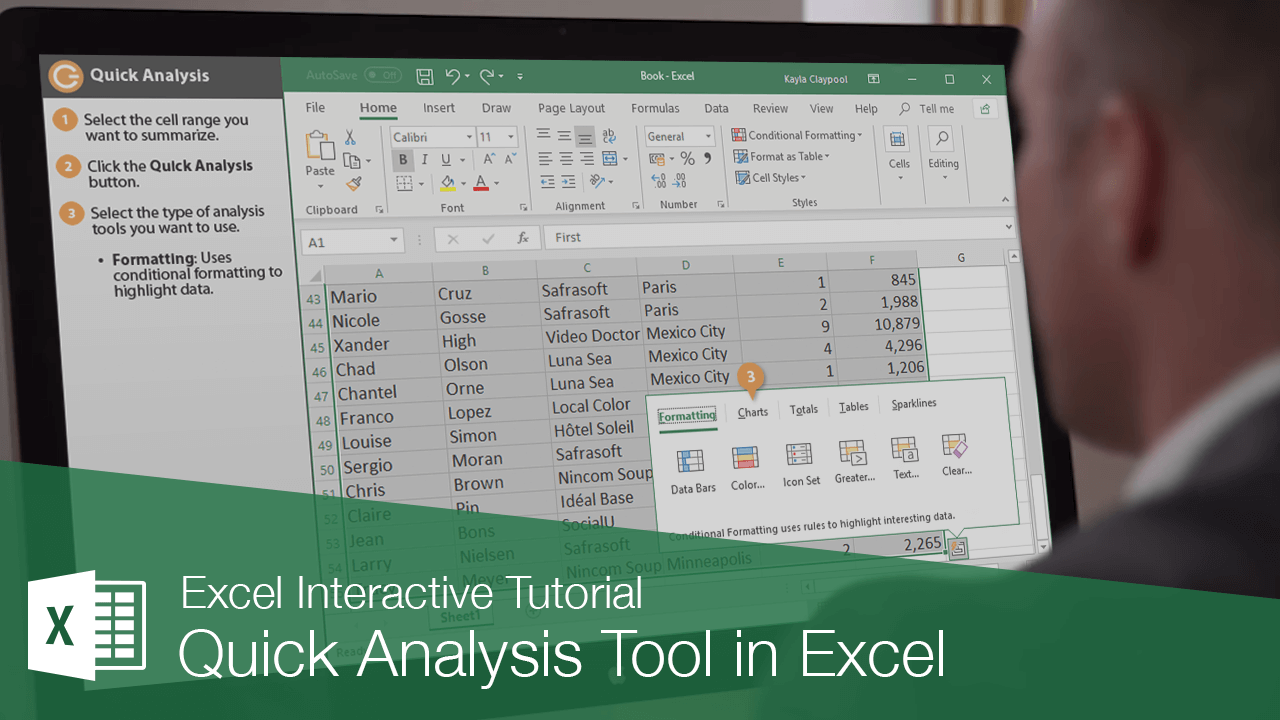
The Quick Analysis function helps you quickly format your data into a chart, table, summary formula, sparkline, or highlighted figures with just a few simple steps.
Use the Quick Analysis Button
- Select the cell range you want to summarize.
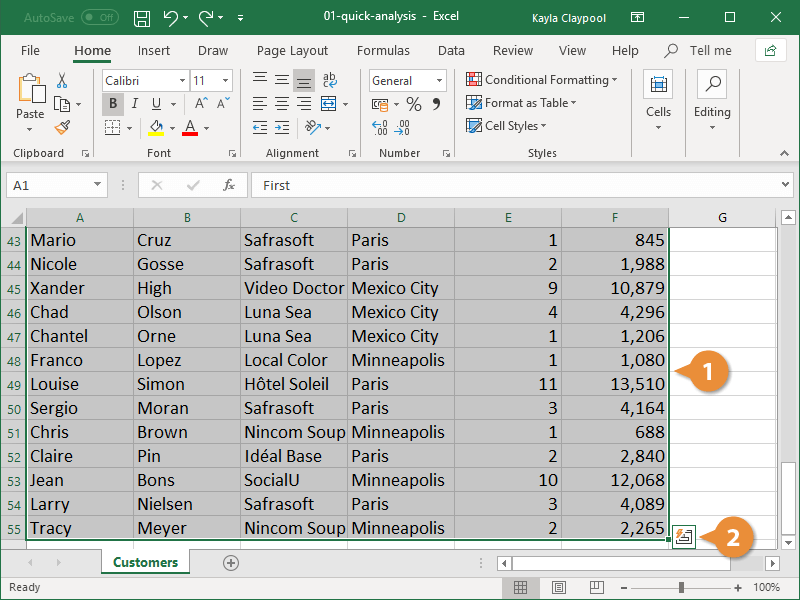
Be careful when selecting your data. The Quick Analysis button will not appear when using the Ctrl key to make multiple selections.
- Click the Quick Analysis button.
- Select the type of analysis tools you want to use.
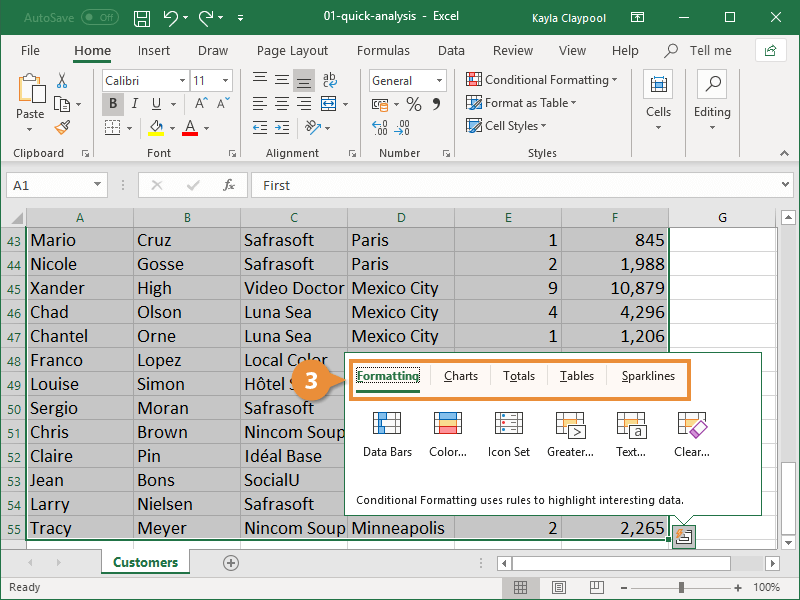
- Formatting: Highlight data using conditional formatting.
- Charts: Chart the selected data.
- Totals: Create common summary formulas.
- Tables: Summarize data in a table or PivotTable.
- Sparklines: Mini charts placed in single cells.