
Interactive Tutorial
Subtotal Function in Excel
Learn How to Use the SUBTOTAL Function in Excel to Summarize Filtered and Grouped Data Accurately
-
Learn by Doing
-
LMS Ready
-
Earn Certificates

Try this Course with a Free Trial
Many spreadsheets are created in a hierarchical style. For example, a worksheet might contain a column for a person or company, followed by a column with sales data. By outlining your worksheets, you make them easier to understand and read. Instead of sifting through irrelevant information, you can collapse an outline to display each group’s bottom line. There are several ways to outline a workbook:
- Using the Auto Outline Feature: The Auto Outline command automatically outlines a selected range of cells or the entire worksheet, based on formulas and the direction of references.
- Grouping Data: You can group rows and columns manually by selecting them.
- Using the Subtotals Feature: The Subtotals command calculates subtotal values for the labeled columns you select. Excel automatically inserts and labels the total rows and outlines the list.
- Using the Consolidate Feature: You can consolidate several sheets using the Consolidate feature.
This lesson explains how to turn on the subtotals feature and then use the outline options to simplify the data view.
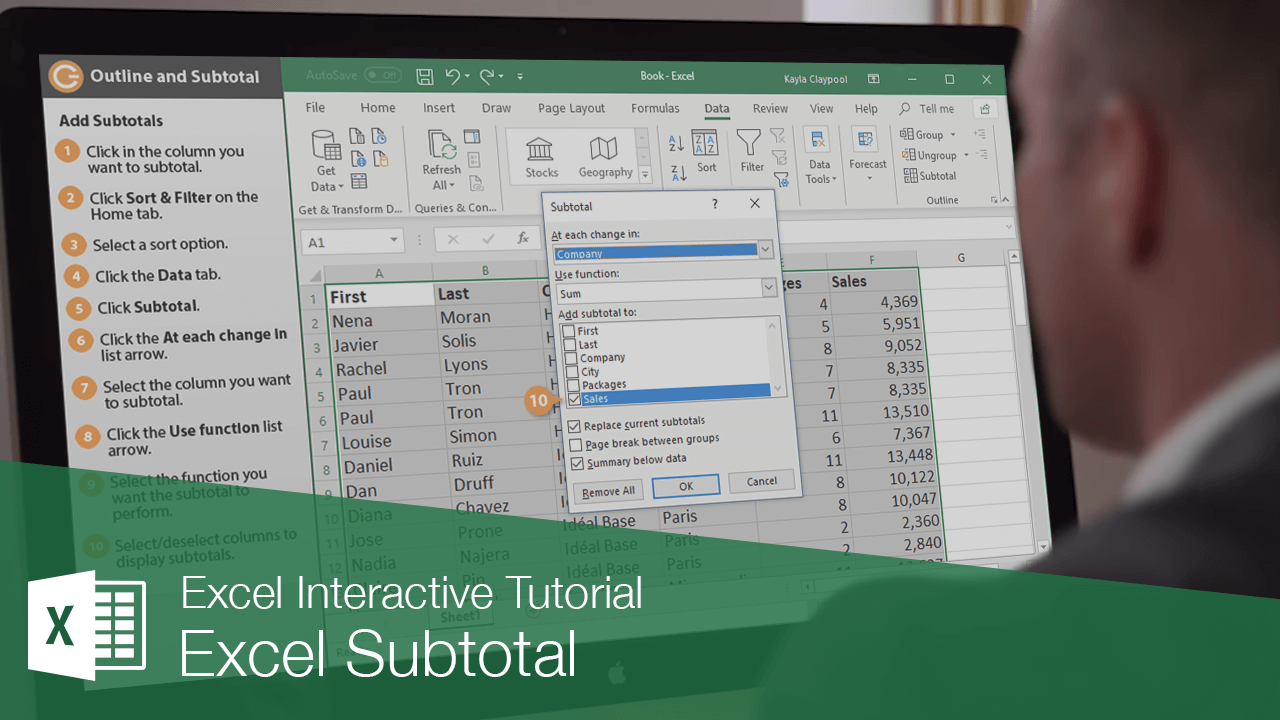
Add Subtotals
Before you turn on subtotals, there are a few preliminary steps that must be completed. First, make sure your data is arranged into labeled columns. The data in each column must also be of the same type and it needs to be sorted based on the column you want to group the subtotals by.
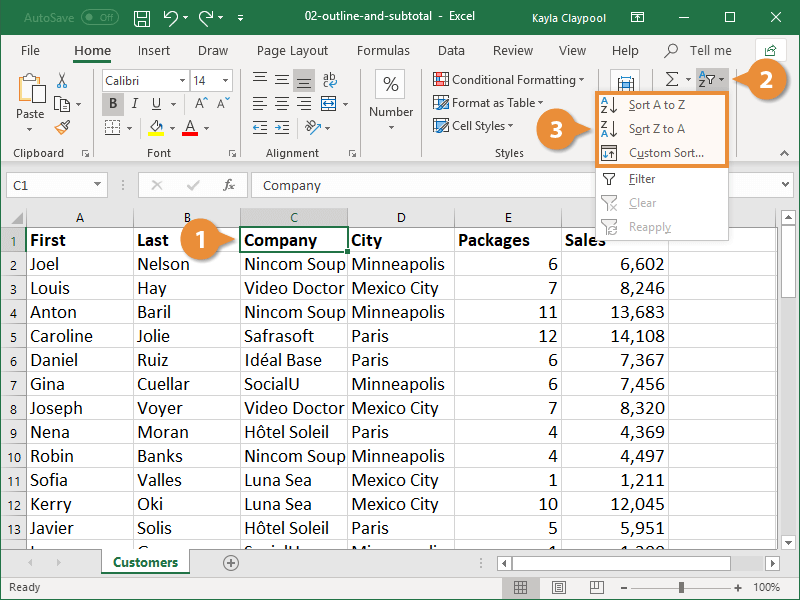
- Click in the column you want to subtotal.
- Click Sort & Filter on the Home tab.
- Select a sort option.
Once the data is sorted, the subtotal can be applied.
- Click the Data tab.
- Click Subtotal.
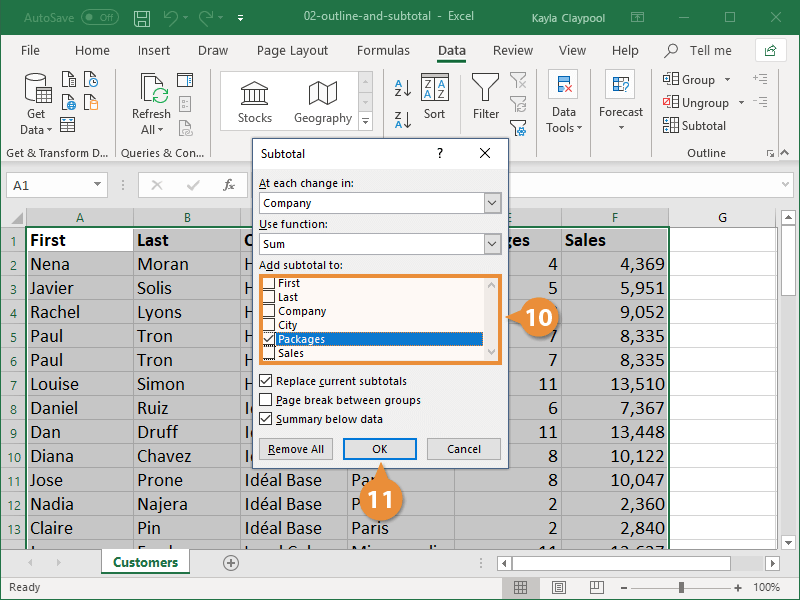
- Click the At each change in list arrow.
- Select the column you want to subtotal.
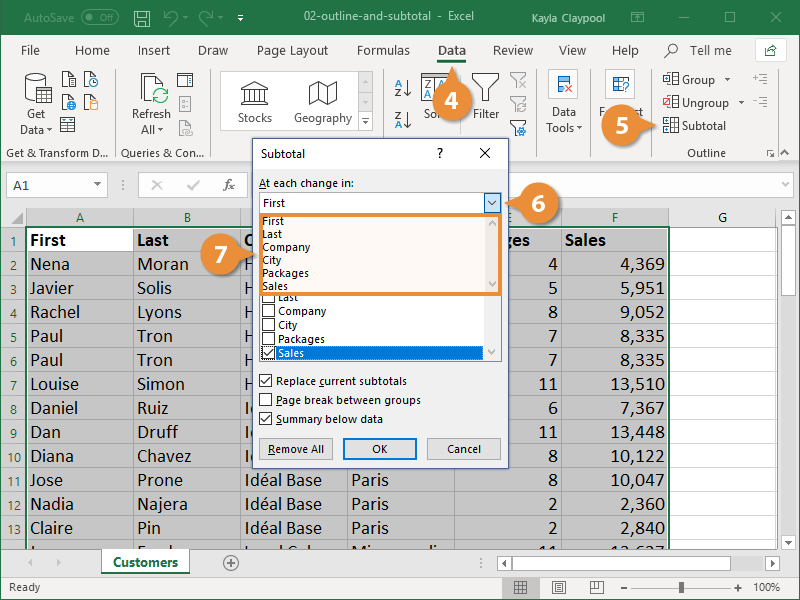
This command specifies what it is that you want to subtotal. For example, if you have a list of people, the company they work for, and the amounts of their sales, and you want to subtotal the list by the company name, you would select the column that contains the company name.
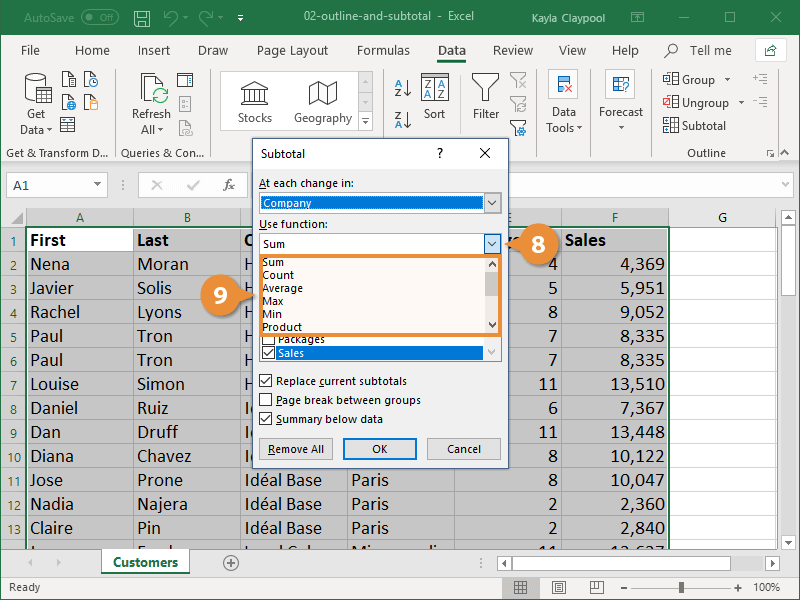
- Click the Use function list arrow,
Usually you create subtotals with the SUM function, but you can also create subtotals using functions such as COUNT, AVERAGE, MAX, and MIN.
- Select the function you want the subtotal to perform.
- In the Add subtotal to box, select the check box next to each column that has values you want to subtotal.
Be careful when selecting your data. The Quick Analysis button will not appear when using the Ctrl key to make multiple selections.
- Click OK.
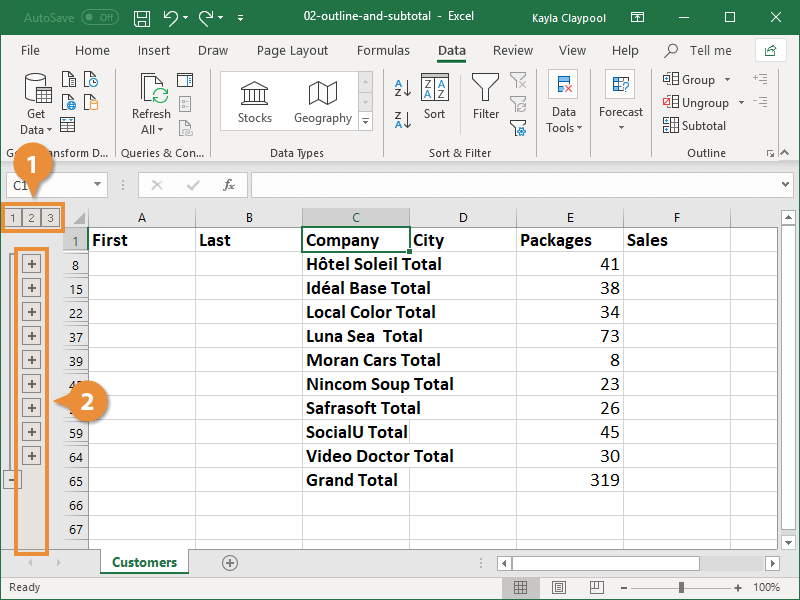
Outline Options
Once subtotals are applied, the outline levels appear at the left. The outline allows you to collapse the detailed rows or columns and view only the subtotals.
- Select an outline level.
- Expand a category to view additional details
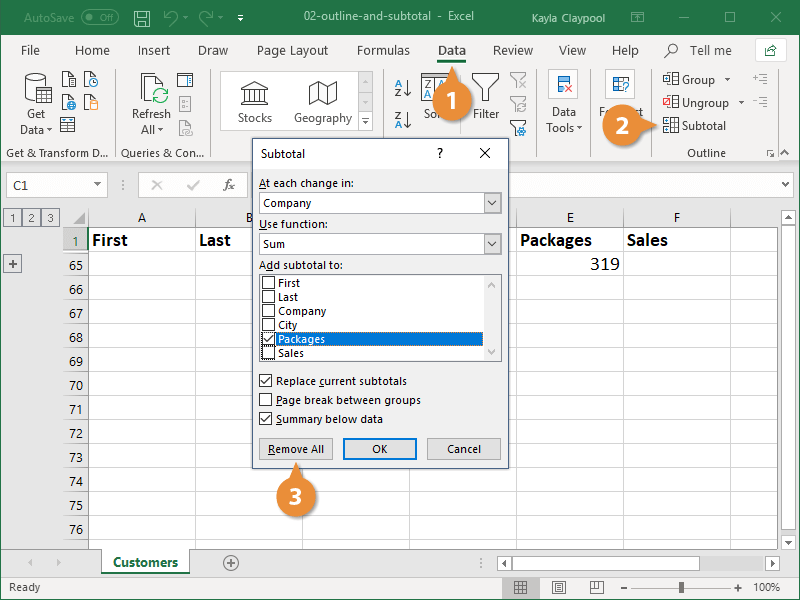
Remove Outlines and Subtotals
- Click the Data tab.
- Click the Subtotal button.
- Click Remove All.
The chart is moved to its own worksheet.