
Interactive Tutorial
How to Create Pivot Table in Excel with Multiple Columns
Learn How to Build Pivot Tables with Multiple Columns in Excel for Detailed Data Comparison and Insights
-
Learn by Doing
-
LMS Ready
-
Earn Certificates

Try this Course with a Free Trial
When adding fields to the Filters, Columns, Rows, and Values areas of a PivotTable, you aren’t limited to just adding one field; you can add as many as you like. However, if you make it too complex, the PivotTable will start to become difficult to consume. You may need to experiment with adding multiple fields to certain areas to see what works best for your set of data. Remember, you can always drag fields out of the area you’ve added them to in the PivotTable Fields pane to remove them.
Let’s refer back to our previous example, where we are only interested in seeing the monthly sales for each destination. After creating the PivotTable, your boss may request to see data for which agents made those sales. Instead of creating a separate PivotTable, you can easily add the Name field as an additional row to expand the data that’s represented.
Add an Additional Row or Column Field
- Click any cell in the PivotTable.
The PivotTable Fields pane appears.
You can also turn on the PivotTable Fields pane by clicking the Field List button on the Analyze tab.
- Click and drag a field to the Rows or Columns area.
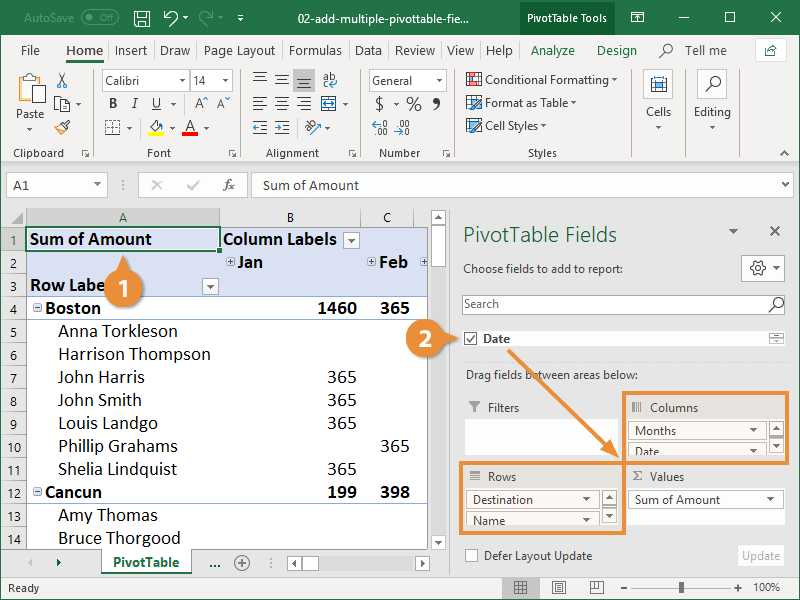
The PivotTable is updated to include the additional values. The order you place the fields in each area in the Fields pane affects the look of the PivotTable. You can drag the field values up or down within an area (the Rows area, for example) to adjust which data appears first.
Some fields, when added to a PivotTable, will automatically be displayed as two fields. For example, when adding a date field to the Columns area, Excel will likely group the dates into months automatically instead of displaying each individual date as a column heading. In the Columns area of the PivotTable Fields pane, you’ll see two fields—Date and Months—even though you only added a single field.
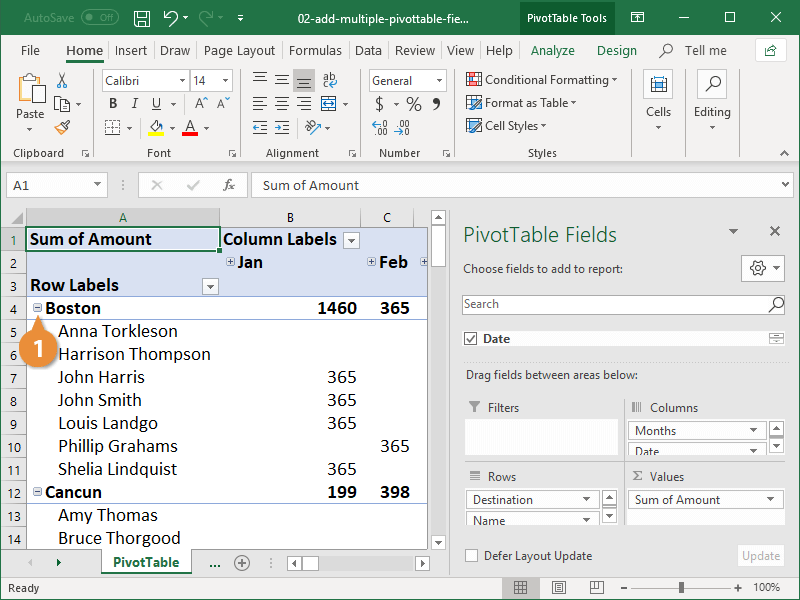
Expand or Collapse a Heading
Once you’ve added more than one value to an area, expand and collapse buttons appear for the top-level values in the PivotTable. Use these to change how much of the data is visible at once.
- Click the Expand or Collapse symbol next to a row or column heading.
Add an Additional Value Field
If your original set of data has multiple columns with numeric values, you may find yourself adding additional fields to the Values area. If this is the case, the PivotTable will display the sum of one set of data followed by the sum of the second set of data in an adjacent column.
- Click and drag a second field to the Values area.
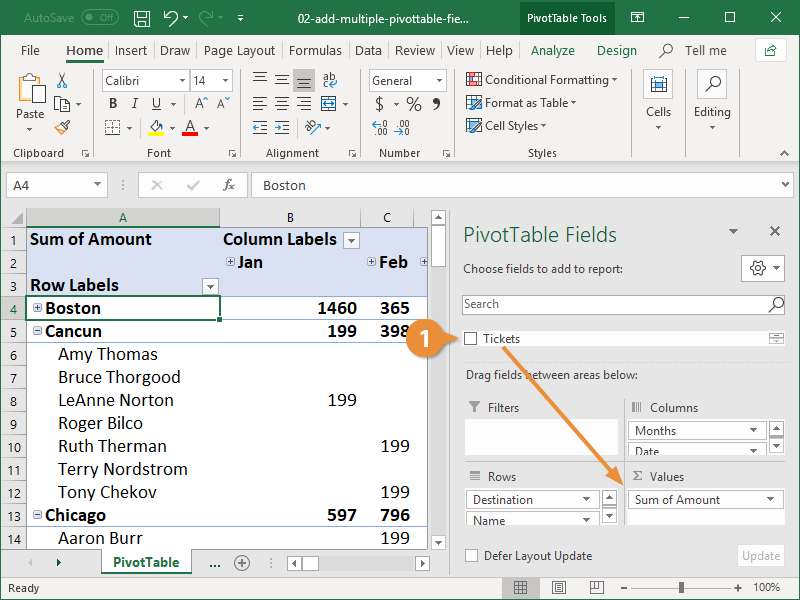
The order in which you place the fields in the Values area is very important. If you add a field and the PivotTable doesn’t look right, try adjusting the order of the fields until the PivotTable displays useful data.