
Interactive Tutorial
Pivot Table Grouping
Learn How to Group Data in Excel Pivot Tables to Organize Information and Simplify Analysis
-
Learn by Doing
-
LMS Ready
-
Earn Certificates

Try this Course with a Free Trial

You can group PivotTable data in order to set it apart from additional subsets of data. You can group most items, but dates are a common item to group. For example, you may want to group the information in the PivotTable by days, months, quarters, or years.
Group PivotTable Values
- Click any cell that has a value you want to group by.
- Click the Analyze tab on the ribbon.
- Click the Group Field button.
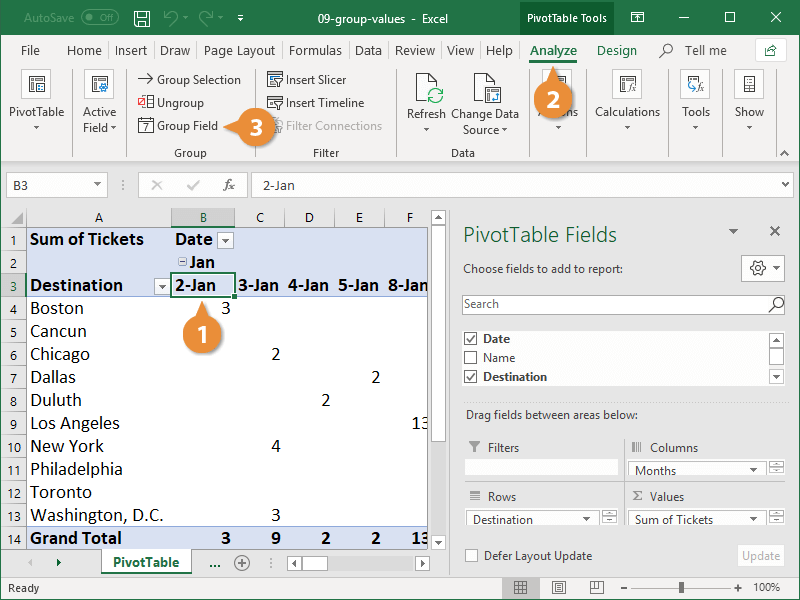
You can also right-click a cell and select Group from the menu.
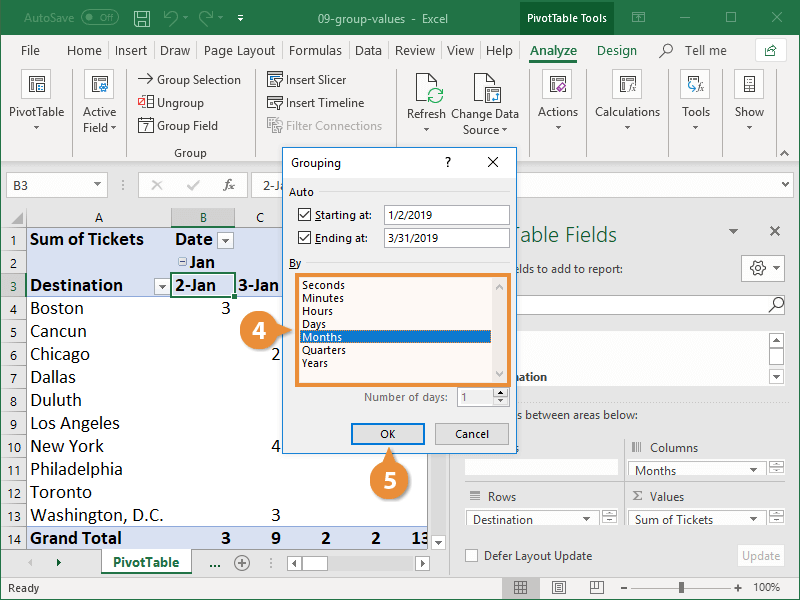
The Grouping dialog box appears.
- Specify how you want to group your PivotTable.
When grouping date values, the default starting and ending dates are the first and last dates in the PivotTable.
To group dates by weeks, select Days in the By area of the Grouping dialog box and enter 7 in the Number of days field below the list.
- Click OK.
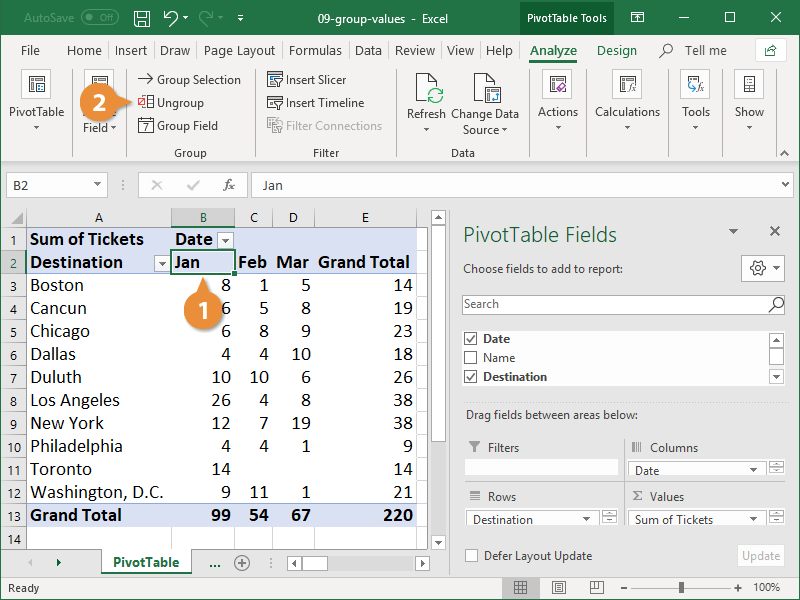
The PivotTable groups together all the data.
Ungroup PivotTable Values
If you decide you want to see the individual values as column headers again, just ungroup them.
- Click a cell that contains the value you want to ungroup.
- Click the Ungroup
button on the Analyze tab.
You can also right-click a cell and select Ungroup from the menu.
The grouping is removed from the PivotTable.