
Interactive Tutorial
How to Make a Graph in Word
Insert and Customize Charts in Word to Visually Display Data and Trends
-
Learn by Doing
-
LMS Ready
-
Earn Certificates

Try this Course with a Free Trial

You can add charts to your documents to help present information graphically. Using them instead of, or in addition to, tables of data can make it easier for readers to understand.
Insert a Chart
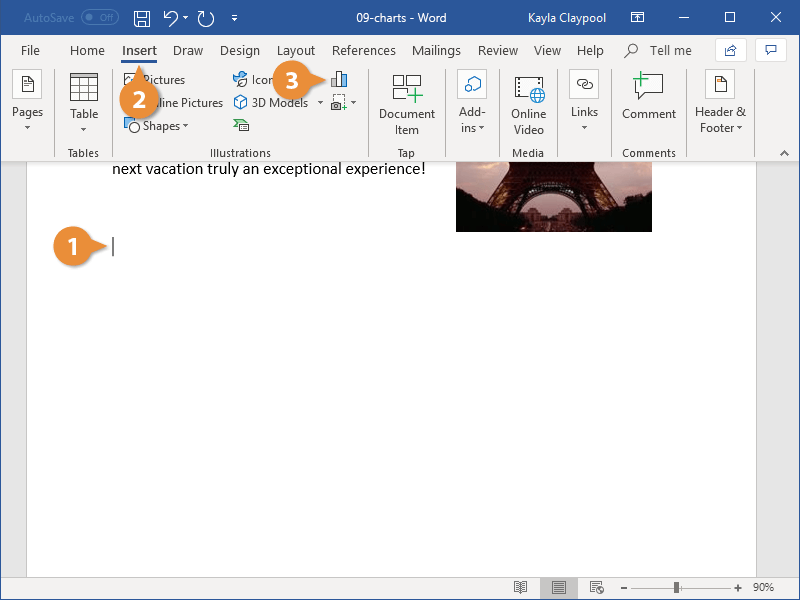
- Click where you want to insert the chart.
- Click the Insert tab.
- Click the Chart button in the Illustrations group.
- Column and Bar charts work well to compare different sets of data against each other.
- Line and Area charts are great for showing trends over time.
- Pie charts show different categories as parts of a whole.
- Select a chart type.
- Select a chart style.
- Click OK.
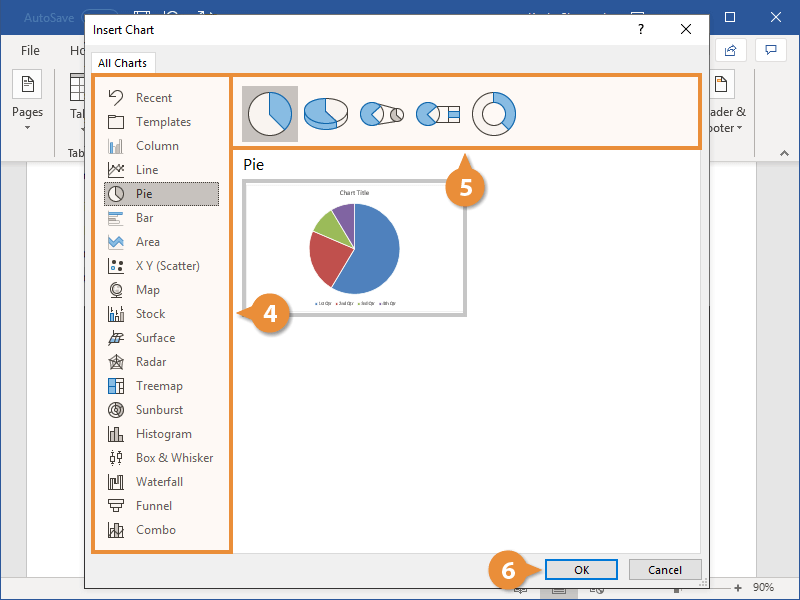
The Insert Chart dialog box lets you choose from a variety of chart types. Some chart types will be better at displaying certain data than others.
The most common types of charts are Column, Line, and Pie.
Each chart type has a few styles to choose from, presenting the data differently.
A blank chart is inserted, along with a spreadsheet full of placeholder data.
Add Chart Data
When a chart is inserted, its spreadsheet will be full of placeholder data that you can replace with your own content.
- Enter your chart data.
- Click the spreadsheet window’s Close button when you’re done.
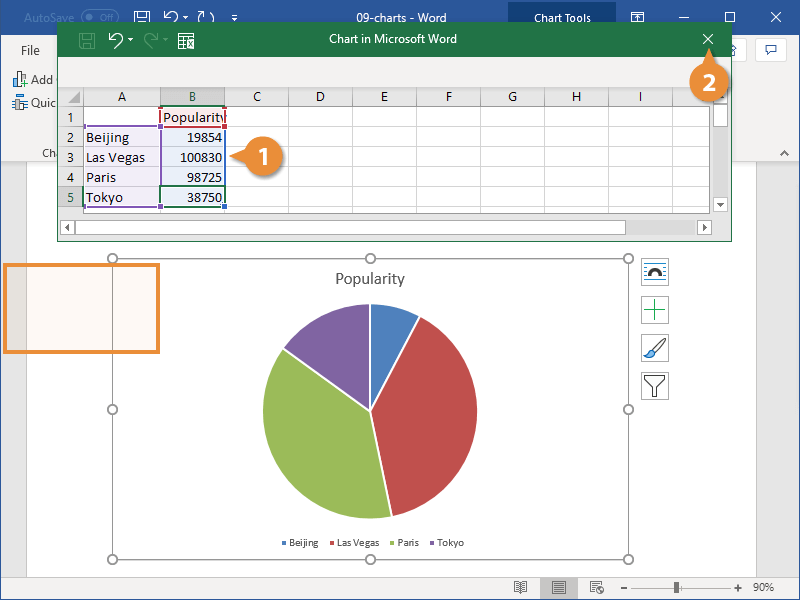
As you add rows and columns, the row headers, column headers, and data are highlighted by borders.
To add or remove sections of the data, click and drag any of the selection handles in the spreadsheet and what’s included in the chart will change.
To reopen the spreadsheet, select the chart, click the Design tab in the Chart Tools ribbon group, and click the Edit Databutton.
Change the Layout
You can quickly adjust a chart’s layout at any point after you’ve inserted it. Layouts will affect the position of chart elements like the title, legend, and data labels.
- With the chart selected, click the Design tab in the Chart Tools ribbon group.
- Click the Quick Layout button.
- Select a layout.
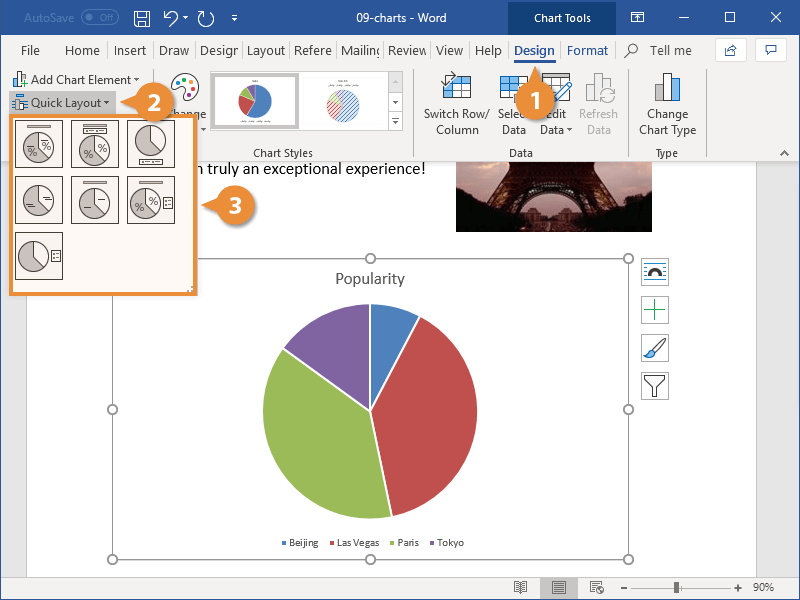
A gallery of available layouts appears, based on the chart’s type.
The layout is applied.
If you want to change the color or style, use the options in the Chart Styles group.
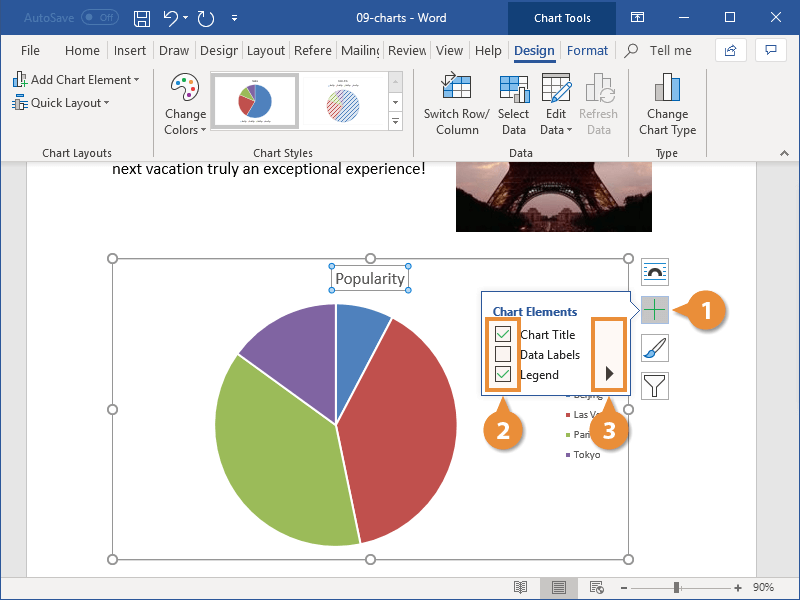
Modify Chart Elements
Another way to change the chart layout is to use the chart tool shortcuts to edit the active chart elements.
- With the chart selected, click the Chart Elements button.
- Click the check box next to the element you want to toggle on or off.
- Click the list arrow next to a chart element and select an option.
Different chart types contain different chart elements. Depending on the chart type, you may be able to adjust gridlines, titles, legends, and data or axis labels.
Each element can also be customized further. You can set the position of elements such as the title or legend, or toggle subsets of specific elements, such as horizontal or vertical gridlines.
You can continue to set up chart elements in this way until the chart appears exactly how you want it.
You can also insert or modify chart elements by clicking the Design tab in the Chart Tools ribbon group, then clicking Add Chart Element.