
Interactive Tutorial
Salesforce Charts
Add and Customize Charts in Salesforce Reports to Visualize Data and Track Performance Trends
-
Learn by Doing
-
LMS Ready
-
Earn Certificates

Try this Course with a Free Trial
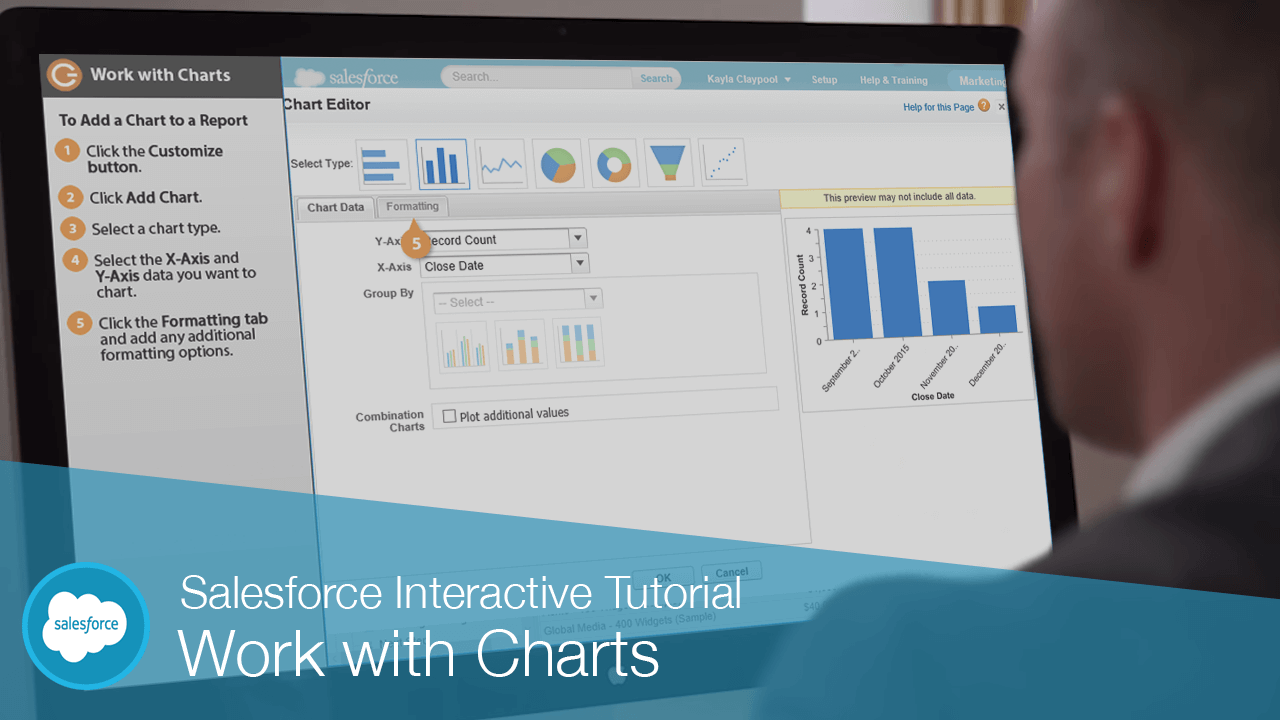
Add a Chart to a Report
You can easily add charts to summary and matrix type reports.
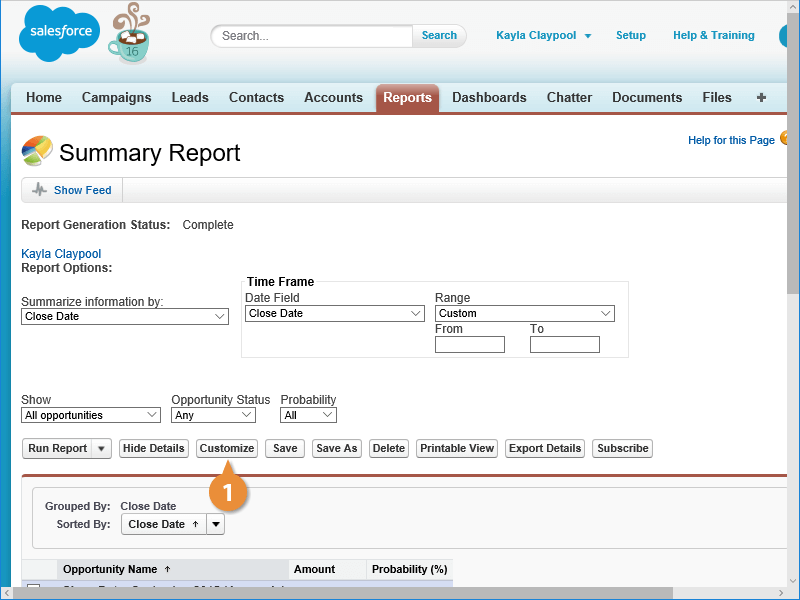
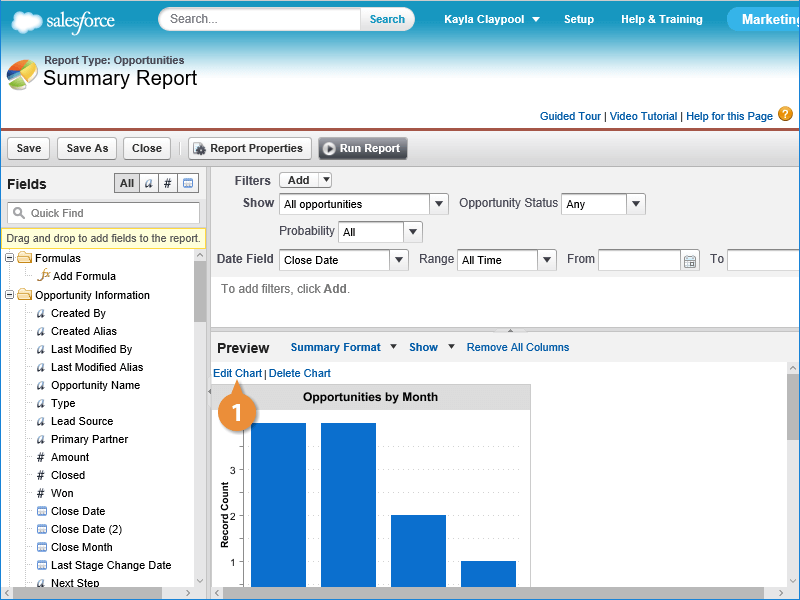
- Customize the report where you want to add the chart.
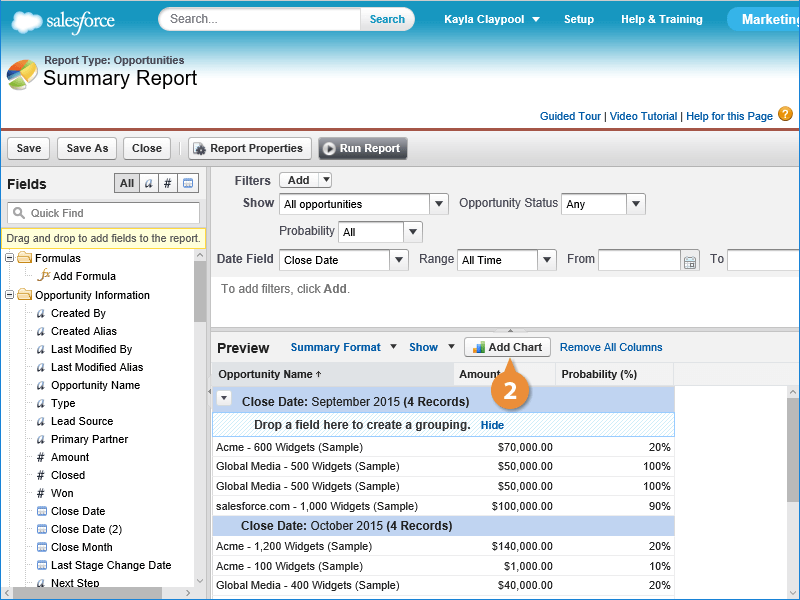
- Click Add Chart.
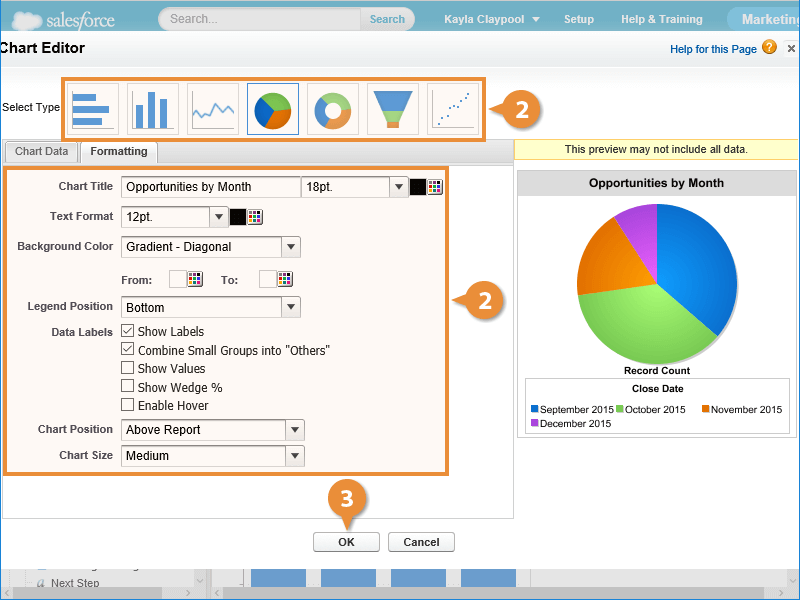
- Select a chart type.
- Select the X-Axis and Y-Axis data you want to chart.
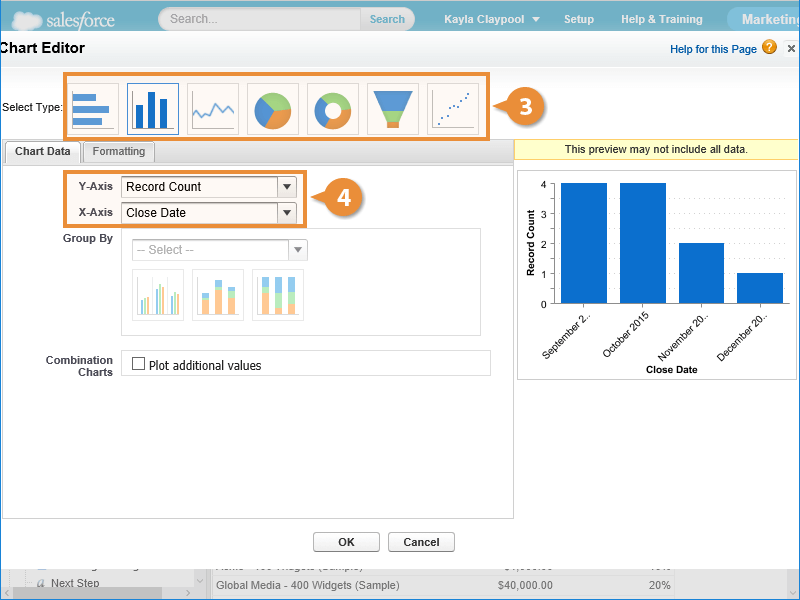
- Click the Formatting tab and add any additional formatting options.
- Click OK to insert the chart.
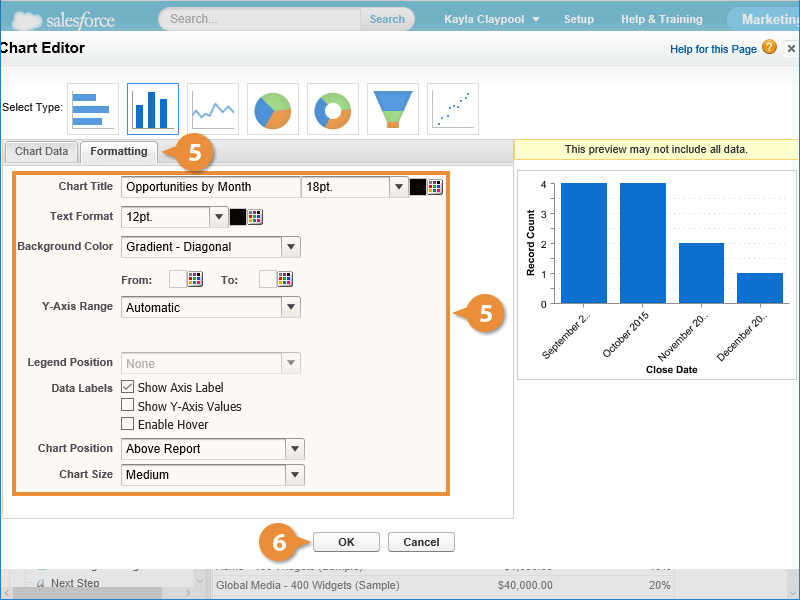
Salesforce adds the selected chart to the report.
Edit a Chart
Once a chart is inserted into the report, you can edit what it displays.
- Click Edit Chart.
- Make the desired changes to the chart.
You can change the chart type, or you can move chart components using the Formatting tab.
- Click OK when you're finished.
The chart is updated with your changes.
Delete a Chart
If you decide you don't need a chart, you can remove it.
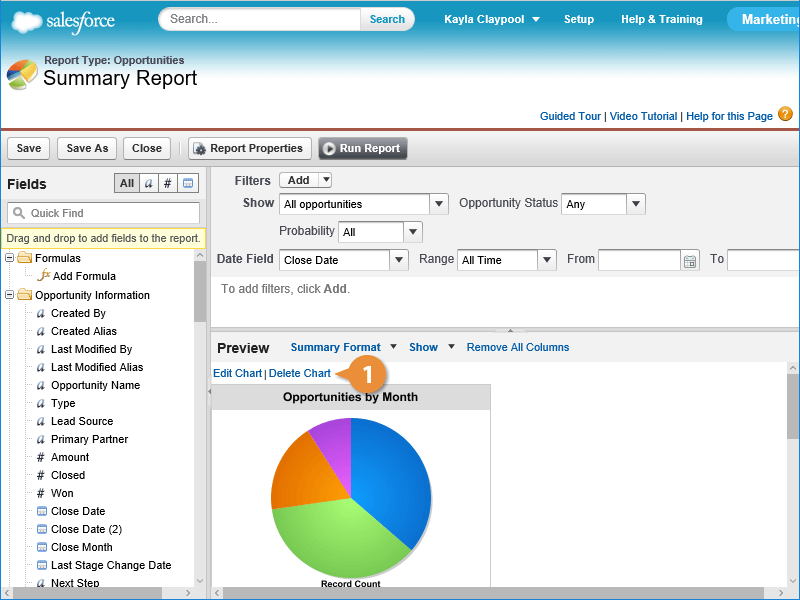
Salesforce removes the chart from the report.