

How to Create a Matrix Report in Salesforce
Design a Matrix Report in Salesforce to Compare Data by Rows and Columns for Deeper Insights
Try this Course with a Free Trial


Create a Matrix Report
A matrix report summarizes information by both rows and columns.
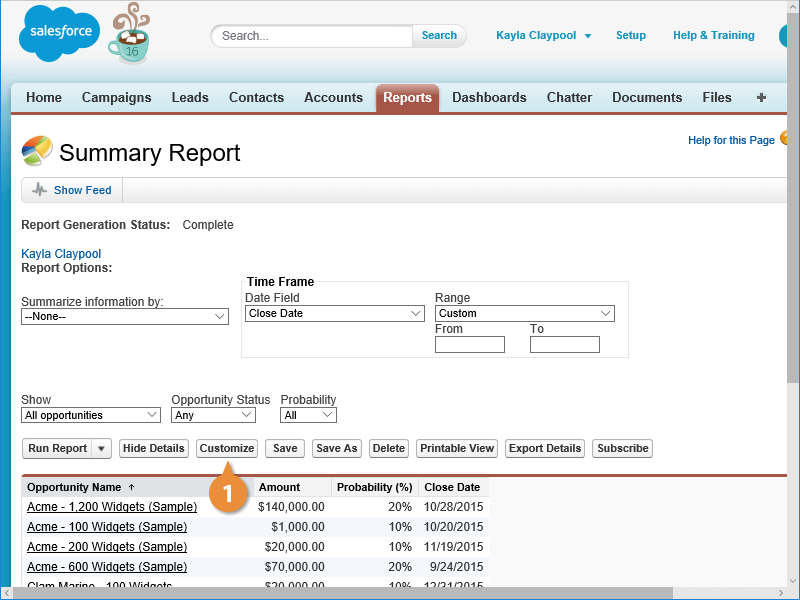
- Customize any tabular report to make it into a matrix report.
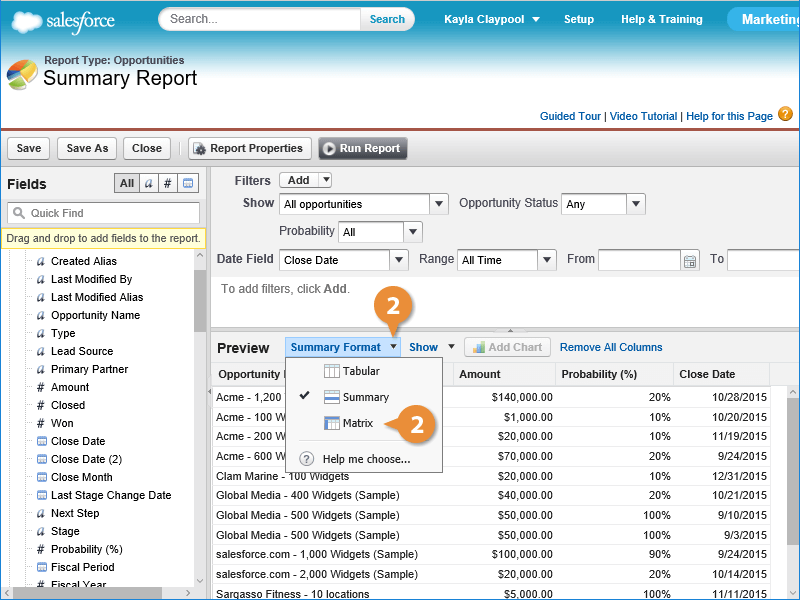
- Click the Summary Format arrow and select Matrix.
Next you need to add the fields you want to use as your row and column headings.
- Click and drag the row header field to the row header area.
Salesforce groups the report by the rows you chose in the report.
- Click and drag the column header field to the column header area.
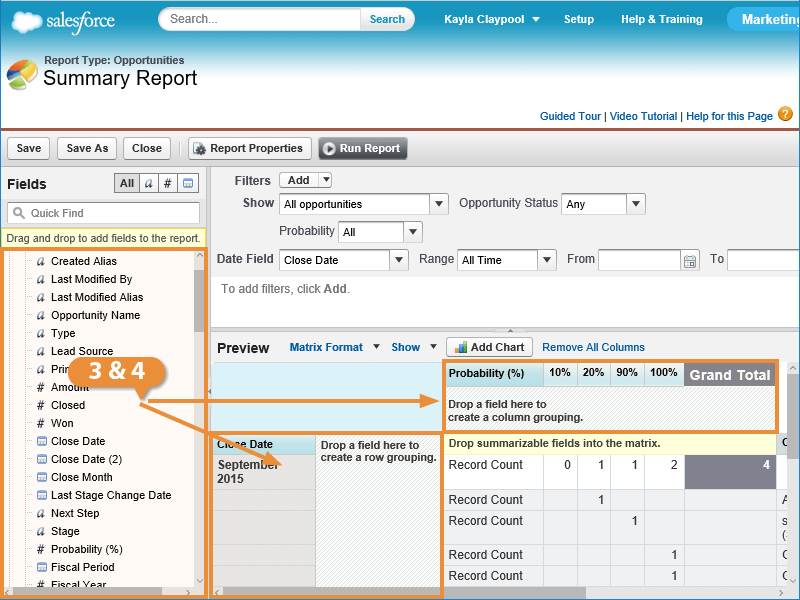
The report summarizes the information by both the rows and columns you specified.
Finally, you can specify any fields you want to calculate.
- If desired, click the arrow next to any field, select Summarize this Field and select a calculation.
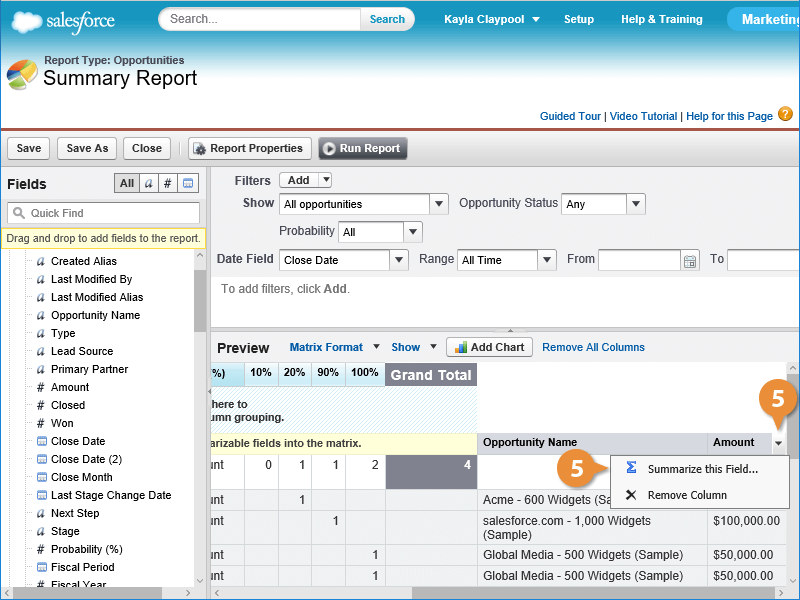
- Check the calculations you want and click Apply.
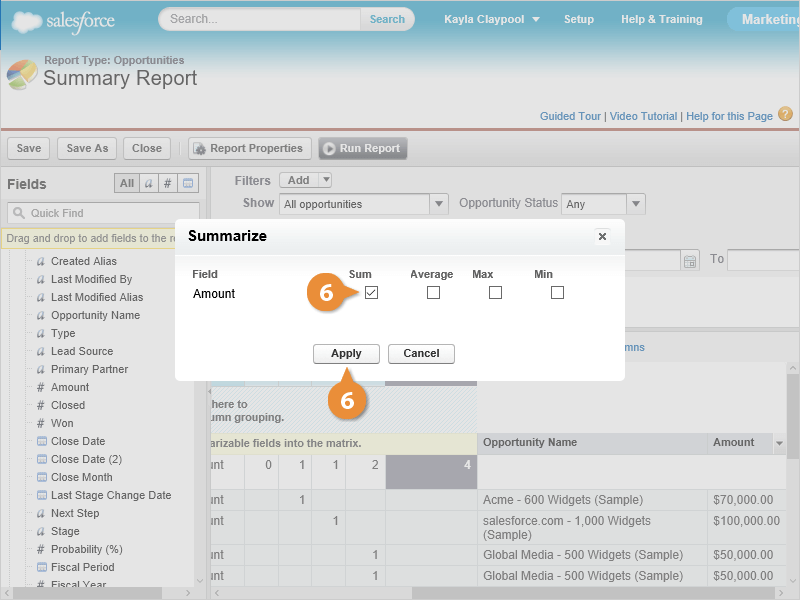
A matrix report is created from the fields you specified.