
Edit a Dashboard
How to Edit a Dashboard in Salesforce
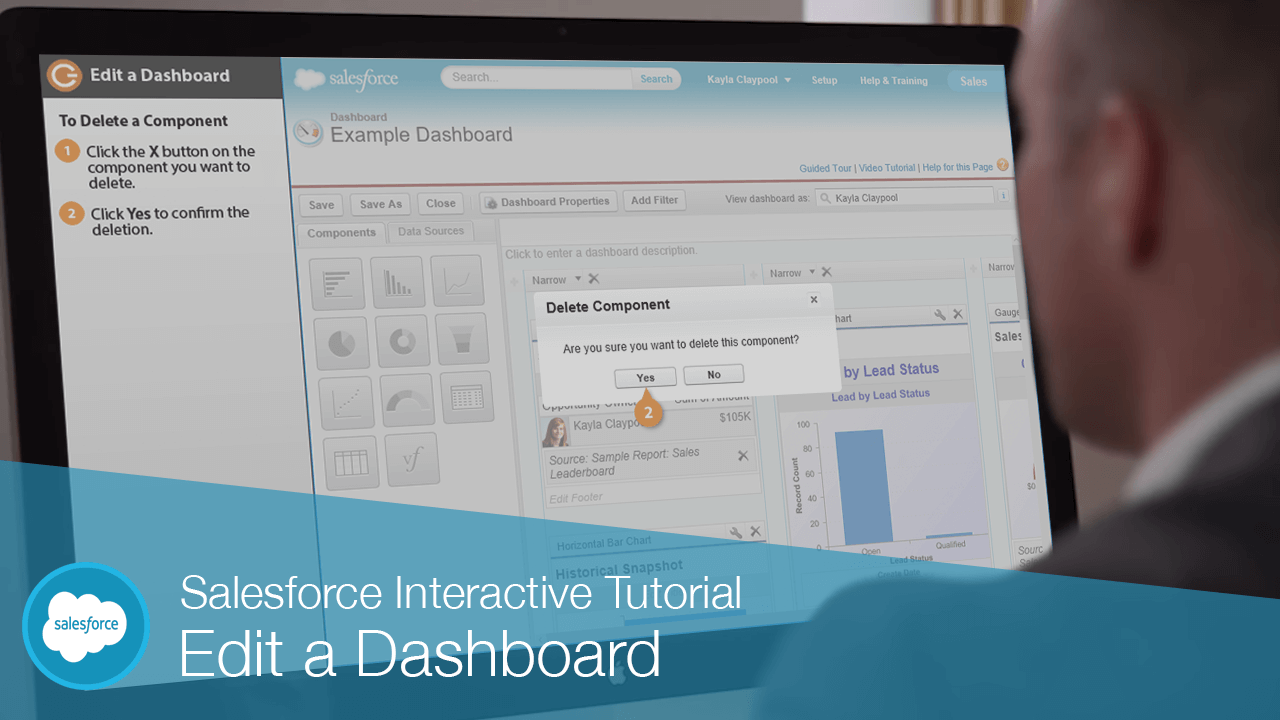
Edit a Dashboard
You have a lot of options to work with when you're editing a dashboard.
Delete a Component
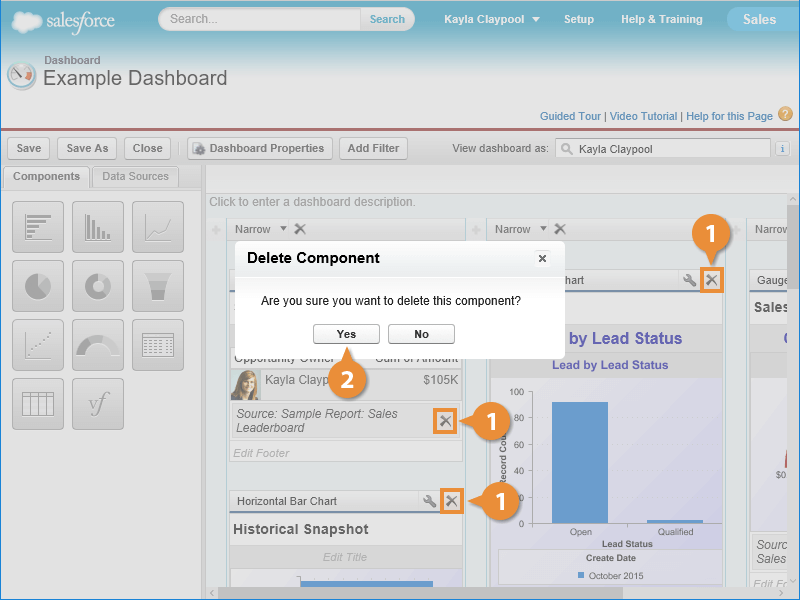
The component is deleted.
Move a Component
You can easily change where a component appears using Salesforce.
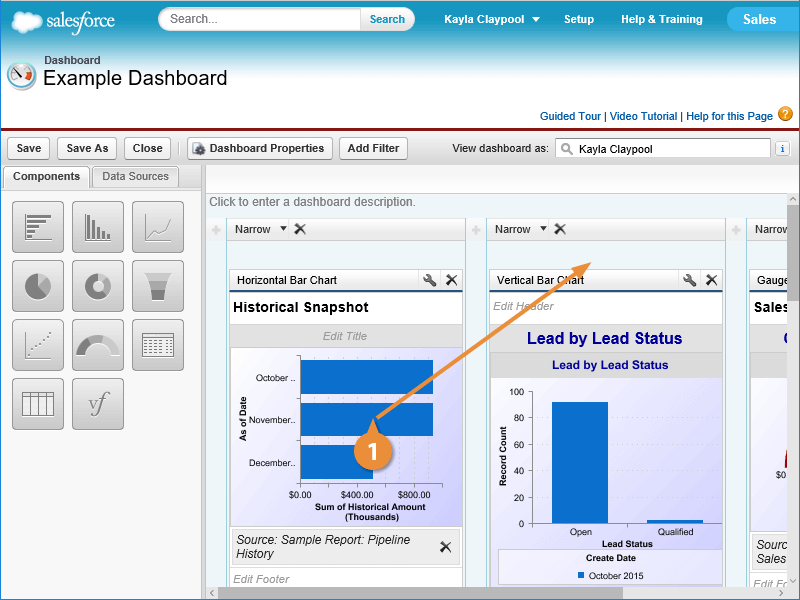
The component moves to the designated position.
Edit a Component
- Click the wrench icon on the component you want to edit.
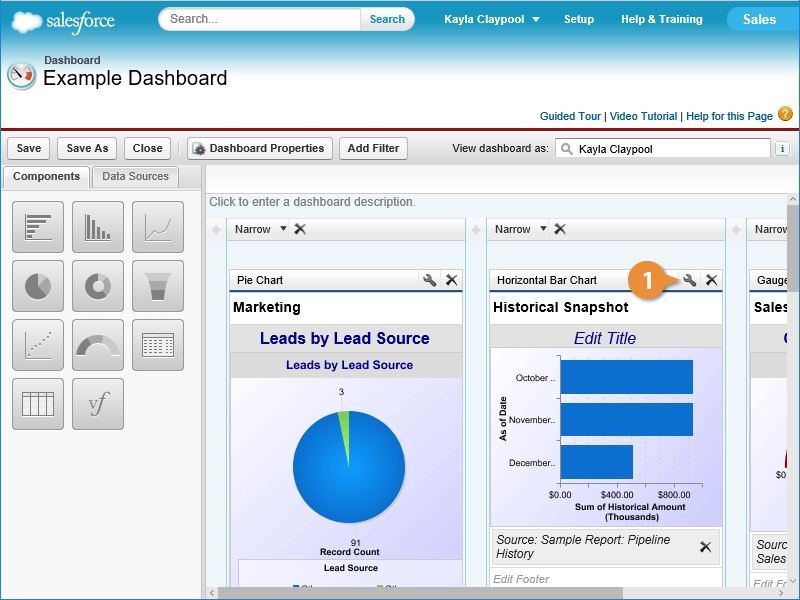
The Component Editor appears.
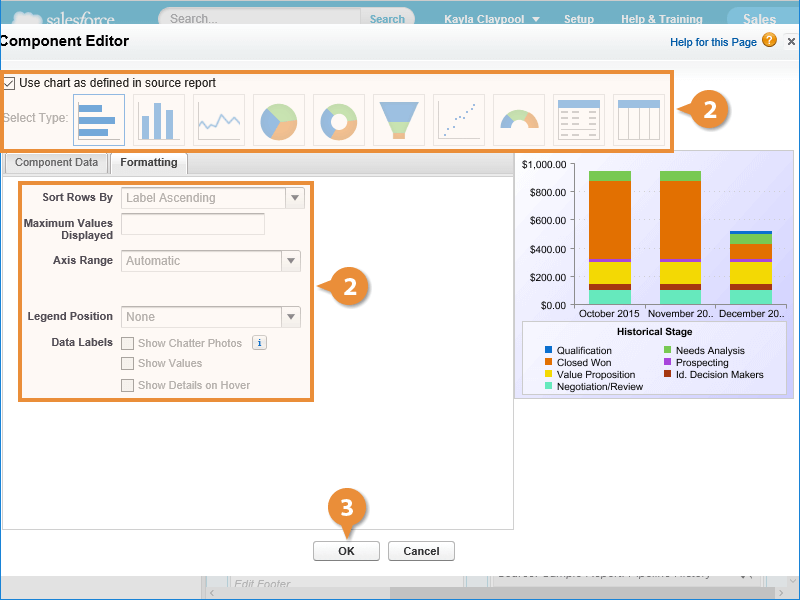
- Make the desired changes.
You can select the kind of chart you want to use for the component. If the report which the component is based on already has its own chart, you can use that. Just check the Use chart as defined in the source report box.
- Click OK when you're finished editing the component.
Change Column Size
Resizing columns is just as easy as manipulating other components of Salesforce.
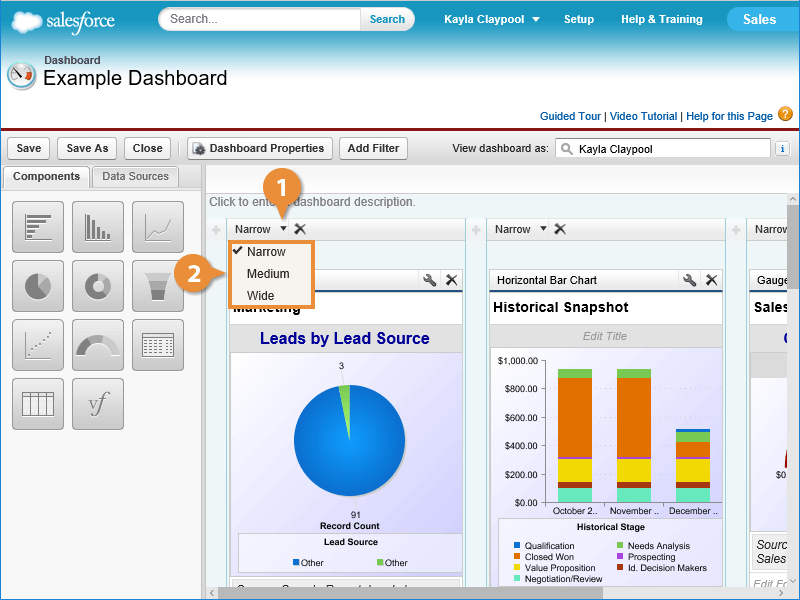
The column is resized.
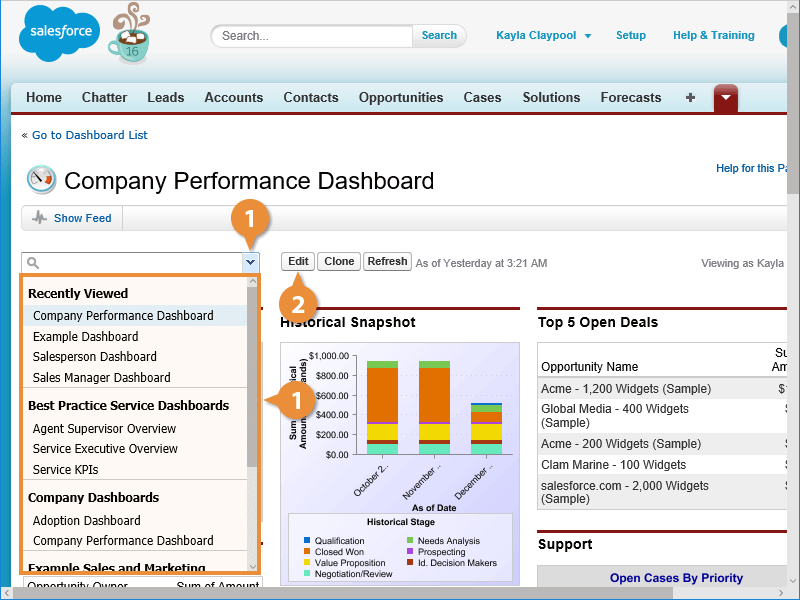
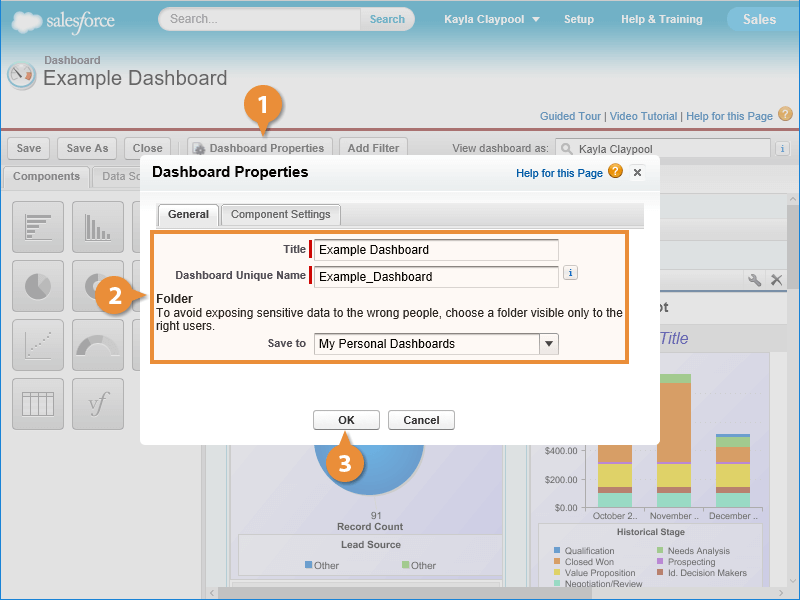
Change a Dashboard's Properties
- Click the Dashboard Properties button.
- Edit the dashboard title and/or folder.
Make the desired changes to your dashboard.
- Click OK to close the Dashboard Properties dialog box.
Save a Dashboard
You’ll want to be able to return to your dashboard. It’s simple to save your project for later. If you're doing a lot of editing, you should save your changes periodically.
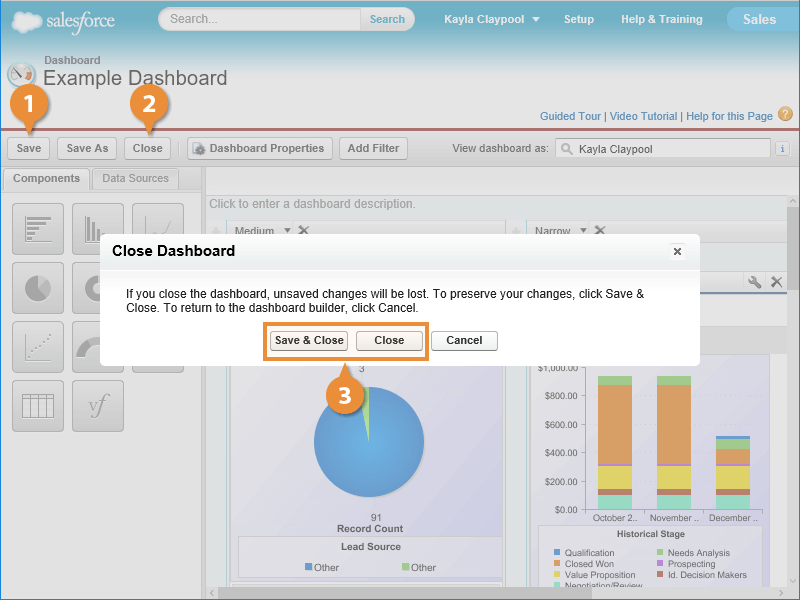
Salesforce exits editing mode and displays the changes you’ve made to the dashboard.